
Growth Charts is a Macintosh OS X application that allows for tracking and charting of growth data for children/teens from birth through age 20 years. It can track weight, length/height, head circumference, and even body mass index (BMI). Additionally, the predicted adult height can be estimated. Using the program, data can be stored, edited, and subsequently plotted on growth charts. The growth charts come from the Centers for Disease Control (CDC) and are the same ones used by pediatricians throughout the United States to monitor for abnormal or concerning growth patterns. If you have ever been curious to follow the growth of your child (or yourself) the same way that the doctor does, this program will allow you to do that using the same charts that your doctor probably uses.
Why is it important to follow growth?
Growth rates vary considerably based on age and gender but tend to follow standard patterns. The CDC has studied the growth of various children and developed charts to help track whether a child's growth is normal or abnormal. These charts show what are deemed to be normal percentiles which are marked by what are known as standard curves. For example, a child at the 90th percentile for height is taller than 90% of his or her age-matched peers. While there is a wide range of what "normal" can mean, outlying values or patterns that deviate from the standard curves can alert parents or physicians that a problem may exist and suggest the need for further examination or testing. Furthermore, it should be noted that there will always be variability in measurements. It is usually (but not always) the trends that are most important to follow.
What is the significance of the predicted adult height?
The predicted adult height is simply an estimate of how tall the child will be based on the height of both parents. Thus, it is mainly an estimate of the genetically determined height. This is only a rough estimate and will vary based on multiple factors. There are also multiple ways to predict the adult height. The formula used in this program was:
Predicted Adult Height (PAH) = ((MH + FH) / 2) + or - 6.5
MH= mother's height (centimeters)
FH=father's height (centimeters)
This formula will add 6.5 if the child is a boy and will subtract 6.5 if the child is a girl. Furthermore, it is hopefully clear that this formula also depends on the fact that the mother and father should be at their final adult heights.
Where can I learn more about growth charts?
While there are many web sites to learn about growth charts (and at least one where functions similar to the current program can be done for a fee), the CDC is probably the best place to look. Their web site is located at
What is the significance of the sample data included with the program?
The children that are included in the program are provided as a demonstration of how the program works. However, it is possible to look at them to see what some abnormal growth patterns look like. The following are descriptions of the data included with the program:
John Doe (Failure to thrive): This data is based on a real patient who had what is known as "psychosocial failure to thrive". His growth was normal until 15 months of age. At that time his mother became addicted to crack and her parenting abilities sharply deteriorated. His weight gain declined first followed by his height gain, which can be a typical pattern of psychosocial failure to thrive. The sharp increase in his weight occurred when he was removed from the home and placed in a more nurturing environment. [Data taken from Atlas of Pediatric Physical Diagnosis, Third Edition, Edited by BJ Zitelli and HW Davis, Figure 6-64, page 170.]
Baby Bob (failure to thrive): This child also had failure to thrive, although the cause was not given. One again, the weight can be seen to trail off from the standard curves, meaning that the child was not gaining weight appropriately. [Data taken from Atlas of Pediatric Physical Diagnosis, Third Edition, Edited by BJ Zitelli and HW Davis, Figure 10-6, page 289.]
Joe (Constitutional delay): Contrary to the name, constitutional delay is considered to be a normal variant. The growth is slow but is is still following the standard curves. In contrast the child "Baby Bob" demonstrated a growth patterns that was "falling off" of the standard curve. [Data taken from Atlas of Pediatric Physical Diagnosis, Third Edition, Edited by BJ Zitelli and HW Davis, Figure 10-6, page 289.]
Fred (hypothyroid): This teenager's height data is provided. His growth was normal until age 11 when he developed hypothyroidism. Because his body did not produce enough thyroid hormone, he failed to grow appropriately. At age 14.5 he started getting thyroid replacement therapy and his growth then resumed. [Data taken from Atlas of Pediatric Physical Diagnosis, Third Edition, Edited by BJ Zitelli and HW Davis, Figure 9-13, page 272.]
Normal baby boy: This is not based on a real child. I simply made the numbers up to try to replicate one example as normal growth as best as possible. I make no guarantees that I did it correctly.
Baby Girl (Mixed Units): Completely made up data. This was just used to demonstrate how the various units can be mixed together on the data entry window.
What are the system requirements?
Growth Charts requires Mac OS X 10.2 or higher.
How much does Growth Charts cost?
This program costs nothing! It's free!
Installation and Usage:
Unzip the archive and then copy the Growth Charts Folder anywhere on your computer. There are three items in the main folder:
1) The "Growth Charts" program
2) The file "About Growth Charts"
3) A folder called "GC data"
Use of the program should be simple. Several data sets are already included with the program as examples. The best way to use this program would be to record the growth parameters at the time of the doctor's visit and then entering them into the computer when you get home. Upon launch of the application, a menu of all children with growth data is presented along with the option to edit the data or add a new child. Once the appropriate child is selected, a growth chart should then be selected and then the points can be plotted via the "Chart" button. There are four basic types of charts, two for ages 0-36 months and two for ages 2-20 years. The 0-36 months charts allows for tracking of weight, length, head circumference and the weight-to-length ratio. The 2-20 years charts allows for tracking of weight, height, and body mass index (BMI) which is a standard way to determine if a person is overweight. This program supports both Metric and American units of measurement.
To launch the program simply double-click on the Growth Charts program icon. The initial window will appear as follows:

The main window
From this window a child can be selected and the appropriate chart can also be selected. The gender of the child as well as their current age is displayed to the right of the name. To add or modify any information about the child click on the Edit button. To add a new child to the list, click on the New button.
Clicking on the Edit button will bring up the following window:
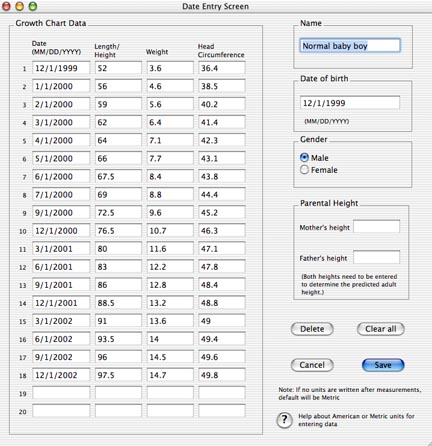
The edit window, reduced from its actual size
In the Edit window, basic information about Name, Gender, and Date of birth can be entered. The mother's and father's height can be entered if the predicted adult height is desired. Additionally, any growth parameters can also be entered in the table on the left. A date for when the measurements were taken must be added since that is how the program determined where to plot the points. Pressing the "Clear all" button erases the data in the table but not the Name, Gender, or Date of Birth. Pressing the "Delete" button will permanently erase the child from the list and this option is not undoable.
Note: Data files are stored as text files in the "GC data" folder. This folder must be in the same folder or location as the Growth Charts program. The data files themselves can have any name if desired, but the format of the data inside the files can't be changed.
Once the appropriate data has been entered or saved, the desired growth chart can be selected from the main menu and the data can be plotted. An example of what this looks like is below:

Plotted growth chart data, reduced from its actual size
The plotted points are the black dots.
The predicted adult height will only be plotted if both the mother's height and the father's height are entered. While the formula used to calculate this predicted height is based on centimeters, either the metric or the American system of length can be used to enter the data and the program will convert the number if necessary. Another requirement for plotting is that the "2-20 years, weight and height" chart must be selected. The way that it will appear on the chart is:
...with the PAH being an abbreviation for "Predicted Adult Height".
More information about the meaning and interpretation of these curves can be found at the CDC web site.
Notes about Units:
As of version 1.1 the program supports both the Metric and the American units of measure. The default is Metric, so if no units are entered, the numbers will be presumed to be Metric. If the American system is used, units must be entered. Examples are provided below.
Length/Height: Metric is the default. Thus, if no units are entered the number will be assumed to be in centimeters. However, "cm" can be appended to the number for clarification. Examples are:
Weight: Metric is the default. Thus, if no units are entered the number will be assumed to be in kilograms. However, "kg" can be appended to the number for clarification. Examples are:
Head Circumference: Metric is the default. Thus, if no units are entered the number will be assumed to be in centimeters. However, "cm" can be appended to the number for clarification. Examples are:
While running the program, pressing the "?" button in the edit window will also demonstrate these issues. Each measurement must be either Metric or American, but the two types of measurements can be mixed for the same child. For example, it is possible to have a child whose weight is recorded in pounds and the height recorded in centimeters.
Why was this method used? Honestly, this may not be the best way to allow for these two systems of measure to be used, but I felt that the metric system is simple enough to understand that units would not be necessary but the American system is sufficiently complicated that units should be necessary. Converting American units can be very confusing and can lead to errors. I have seen people (including physicians!) make errors in these conversions. For example, 5 pounds 8 ounces is equivalent to 5.5 pounds NOT 5.8 pounds. Likewise, 5 feet 6 inches is equivalent to 5.5 feet, NOT 5.6 feet. Thus I thought it was best to keep the units separate as "5 ft 4 in" as opposed to having the user try to convert it to just feet or inches or to the metric system.
Notes about numbers:
If you live in a country such as Spain where numbers are written as "123,45" instead of the American way such as "123.45", then you should enter the numbers as you would normally. However, the sample data files are only written for the American system so you will need to change the numbers in the sample data files if you wish to plot them.
Notes about data consistency:
When data is entered and the "Save" button is pressed, the program will perform some checks to make sure there is some logical consistency to the data. For example:
Be aware that there are some things the program doesn't check for. For example one could successfully enter "500 ft" or "2000 lb" for example, and the program will also not check for negative numbers. So please be careful on how the data is entered.
Current Limitations:
As far as I know the charts can't be printed at this time. Additionally, a monitor with a vertical resolution of at least 768 pixels is required for the program to display properly and it isn't possible to scroll through the window if the screen is smaller. If anyone can offer me assistance on these matters I'd greatly appreciate it!
Future Directions:
There are currently no plans to enhance Growth Charts other than minor bug fixes. At some point a new web-based version that will run on any operating system may be released, but that will depend on how much time I have available to work on it. Unfortunately, as is mentioned in the "Current Limitations" section above, I am unable to allow for printing of the screens and thus it won't be added unless someone can show me how to do it (I'm not even sure if it's possible for this program).
Legal issues:
Growth Charts is provided "as is" and no guarantee is made as to its function or any problems that occur as a result of its use. Use it at your own risk. Nothing included in this document or the program is to be viewed as medical advice. If you have any concerns the meaning of the data, please talk to your doctor!
Warranty:
There is no warranty for this program.
Note to users upgrading from a previous version:
If you are upgrading from a previous version, to keep any data files you have already created, drag the folder called "GC data" from the folder containing the older version to the folder containing the newer version of the program. It is OK to replace the folder that came with the program since the folder only contains sample files.
Version History:
version 1.2.3:
version 1.2.2:
version 1.2.1:
Version 1.1.1:
Version 1.1:
Version 1.0:
Feedback:
I would love to hear any feedback about problems, bugs, suggestions, complaints, etc. If you find it useful I would love to hear from you!!
Send e-mail to David Hanauer: david@supermagnus.com
This program can be found at http://www.supermagnus.com
June 08, 2007